YouTube Niche Saturation: 3 Signals Your Niche Is Dying
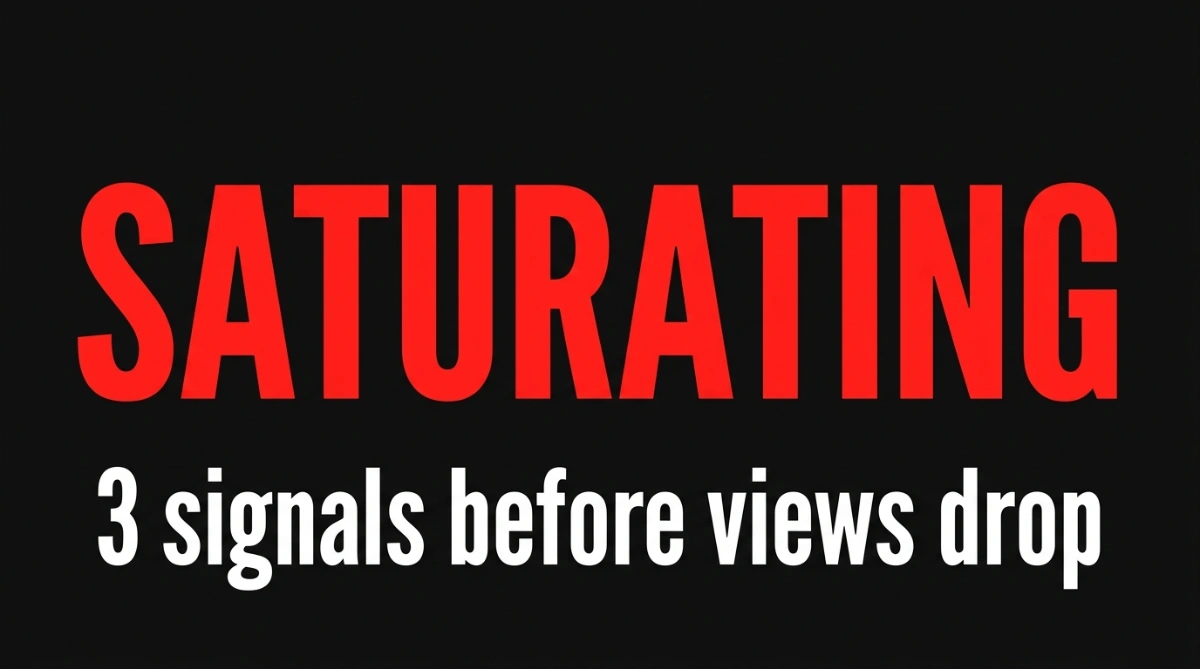
Your niche is dying. Your views are still fine. That gap is the whole problem, and the most repeated explanation for it is not something YouTube has ever published. By the time YouTube Analytics shows a decline in views, your impressions have usually been narrowing for weeks. This guide separates the saturation signals YouTube documents in its own Help Center from the one the creator internet invented, and gives you three checks you can run in YouTube Studio this afternoon.
What Is YouTube Niche Saturation?
Saturation is what happens when the number of quality creators serving a topic grows faster than the number of people who want that topic. YouTube names the second half of that ratio: "Topic Interest is how many people worldwide are interested in and watching videos about a given topic." When Topic Interest holds flat and creator supply climbs, every channel's share of the same audience shrinks.
Saturation does not arrive for everyone at once. YouTube's recommendation documentation names two personalization inputs — Watch History and Interest Affinity — plus a performance input: whether viewers "choose to click, watch, or positively engage with the content." That is the published list. Terms you will see on creator blogs, such as channel authority scores or content library depth, appear nowhere in those pages. A 400-subscriber channel and a 400,000-subscriber channel are matched to viewers by the same signals; the larger one just has more habitual subscribers, which hides the squeeze longer.
Why Don't Views Drop First?
Views lag because your subscriber and search traffic keep paying out after discovery traffic has already thinned. Loyal subscribers still see you in their Subscription feed. Your evergreen videos still rank for long-tail queries. Those two floors hold the total up while the recommendation surface quietly stops offering you to strangers.
YouTube's performance FAQ states the mechanism plainly: the system "doesn't promote videos to your audience but rather finds videos for your audience when they visit YouTube." The same page names two reasons a channel declines: "Your audience is watching more of other videos and channels on YouTube. Your audience is spending less time on YouTube." Notice that the first reason is a description of saturation written from YouTube's side of the glass.
What Is the First Signal of Niche Saturation?
Impressions falling while your retention and click-through rate hold steady is the earliest signal you can measure. YouTube states the rule directly: "Even if you have good metrics on your video, you may get fewer impressions if videos from other channels are performing even better."
That sentence inverts the usual diagnosis. Your thumbnails did not get worse. Your pacing did not get worse. The pool of alternatives for the same viewer got better. The system is doing its stated job — surfacing whichever video is likeliest to satisfy the person in front of it.
How to check: open YouTube Studio, go to Analytics, then the Reach tab. Compare the impressions trend across the last 90 days against average view duration and click-through rate over the same window. Impressions sliding while the other two stay flat or improve points at the competitive field, not at your content. If you are still choosing a topic rather than defending one, check saturation before you commit instead.
How Does Thumbnail Competition Reveal Saturation?
When every thumbnail in a niche converges on one template, click-through rate compresses for the whole niche, not just for you. YouTube frames the thumbnail as a contest: "your video thumbnails are always competing against other videos, whether on the homepage, 'Up Next' on the watch page, in search results, and even in subscription feeds."
Early in a niche, thumbnails differ enough that a viewer reads each one in half a second. As the niche fills, creators copy whatever format won last quarter — same three-colour palette, same four-word overlay, same open-mouth reaction. Five near-identical tiles give the viewer no reason to pick yours.
The benchmark most often quoted here is also the one most often trimmed. YouTube's wording is: "Half of all channels and videos on YouTube have an impressions CTR that can range between 2% and 10%." The next sentence is the one that gets dropped, and it is the one that matters for a small channel: "New videos or channels (like those less than a week old), or videos with fewer than 100 views can see an even wider range." So a 1.8% CTR on a three-day-old video with 60 views is not evidence of anything. Diagnose the niche from a 90-day trend across many videos, never from one upload.
How to check: search your top five keywords on YouTube and look at the first 20 results. If more than half share one layout, one colour family, and one text placement, the niche has reached the convergence stage. Reading where a niche sits in its lifecycle is the same exercise run one level up.
Does YouTube Test Your Video With a Seed Audience?
YouTube does not document this, and the claim should not be the basis of your decision. The "seed audience test" story — every upload goes to a small initial group, and if they engage YouTube expands it — is repeated across creator blogs as officially confirmed. We checked the four Help Center pages where it would live: the performance FAQ, the recommendation system page, the search and discovery tips, and the impressions and CTR FAQ. None of them describes a test group, a seed batch, or an expansion threshold.
An absent doc is not proof that no such mechanism exists inside YouTube. It is proof that nobody outside YouTube can tell you the size of that group or the threshold it has to clear — so any advice built on those numbers is invented. What the pages do describe is enough: the system finds videos for a viewer, and when that viewer has more comparable videos available, yours is selected less often. The symptom a creator observes is identical. The cause, and the fix, are not.
This distinction changes one common piece of advice. If uploads were failing a hidden test, the rational move would be to stop varying your output. YouTube's guidance runs the other way: "It's important that you always keep experimenting with new topics and formats. To build an audience, creators need to both retain their existing viewers and attract new ones." That same page adds where decline actually shows up: "What can lead to a decline in overall channel views is when viewers stop watching most of your videos when they're recommended to them."
How to check: open the traffic source breakdown for your five newest videos. If the share from Browse features and Suggested videos is falling while Subscription and Search hold, the recommendation surface is offering you to fewer strangers. That is a measurement you own, and it needs no theory about batch sizes.
What Order Do These Signals Appear?
The signals arrive in sequence, and the stage you are in decides how much room you have to move.
Stage 1 — Impressions shrink quietly. More capable creators serve the same Topic Interest. Your click-through rate and retention hold, but impressions slide. Most creators miss this because the view count, propped up by subscribers and search, has not moved.
Stage 2 — Thumbnails stop converting. Visual differentiation disappears across the niche and click-through rate compresses toward the low end of the 2–10% band. Fewer impressions now convert at a lower rate, and the two effects multiply.
Stage 3 — New uploads stop reaching strangers. Browse and Suggested shrink as a share of each new video's traffic. Every upload lands slightly softer than the last, gradually enough to blame on luck.
Final stage — Views drop. Only now is it visible on the front page of Analytics. By this point the shift has been running for weeks or months, and you are reacting rather than choosing.
How Do You Tell Saturation From a Content Problem?
Use this table before you conclude anything, because three of the four patterns below are not saturation.
| What you see in Studio | What it usually is | What it is not | Next move |
|---|---|---|---|
| Impressions down 90 days, CTR and retention flat | Niche competition rising | A thumbnail problem | Audit who entered the niche; consider a narrower angle |
| Impressions flat, CTR down across the niche | Thumbnail convergence | Falling demand | Break the visual template your niche settled on |
| Impressions up, CTR down, only on your channel | Packaging mismatch | Saturation | Fix title and thumbnail against the promise of the video |
| One new video underperforming, under 100 views | Normal variance | A signal of any kind | Wait for a 90-day trend before diagnosing |
What Should You Do When You Spot These Signals?
Narrowing your angle is a competitive decision, not obedience to an algorithm — and it works best at Stage 1. A sub-niche keeps the expertise you already built and changes only who the video is aimed at. It is worth doing when a smaller slice of the same Topic Interest has fewer capable creators serving it, and it is worth skipping when the slice is too small to sustain uploads.
Hold that alongside YouTube's guidance to keep experimenting with topics and formats. The two are compatible: narrow the audience you are aiming at, keep varying the formats you aim at them. What the documentation does not support is freezing your output to protect a hidden score — a claim we traced through the 2026 Browse feed commitment story and could not ground in any YouTube source.
Timing decides your options. Moving at Stage 1 means moving with stable metrics, an engaged subscriber base, and time to test angles. Moving at Stage 3 works but you are pivoting into declining momentum. Moving after views drop means starting behind. Checking impressions monthly is what buys you the earlier slot, and outliers repeating across several channels tell you which adjacent angle already has demand.
Judging a candidate sub-niche by eye is where creators lose months. Gleam scores demand against competition from public YouTube data, so comparing your current slice with an adjacent one gives a number rather than a hunch — the same check behind finding a low-competition niche. You can start a free trial and score a candidate before planning a single video.
Quick reference — the saturation signals in order:
- Signal 1: Impressions decline while retention and CTR stay flat
- Signal 2: Thumbnail convergence compresses CTR across the whole niche
- Signal 3: Browse and Suggested shrink as a share of new-video traffic
- Final stage: Views drop — by then Signals 1 to 3 have already played out
Every source above is a YouTube Help Center page, checked on 30 August 2026. Where a repeated claim had no YouTube source, we say so instead of repeating it.
Ready to find your next video idea?
Gleam helps you discover content gaps and outlier videos with real YouTube data.
Start Free TrialRelated Articles
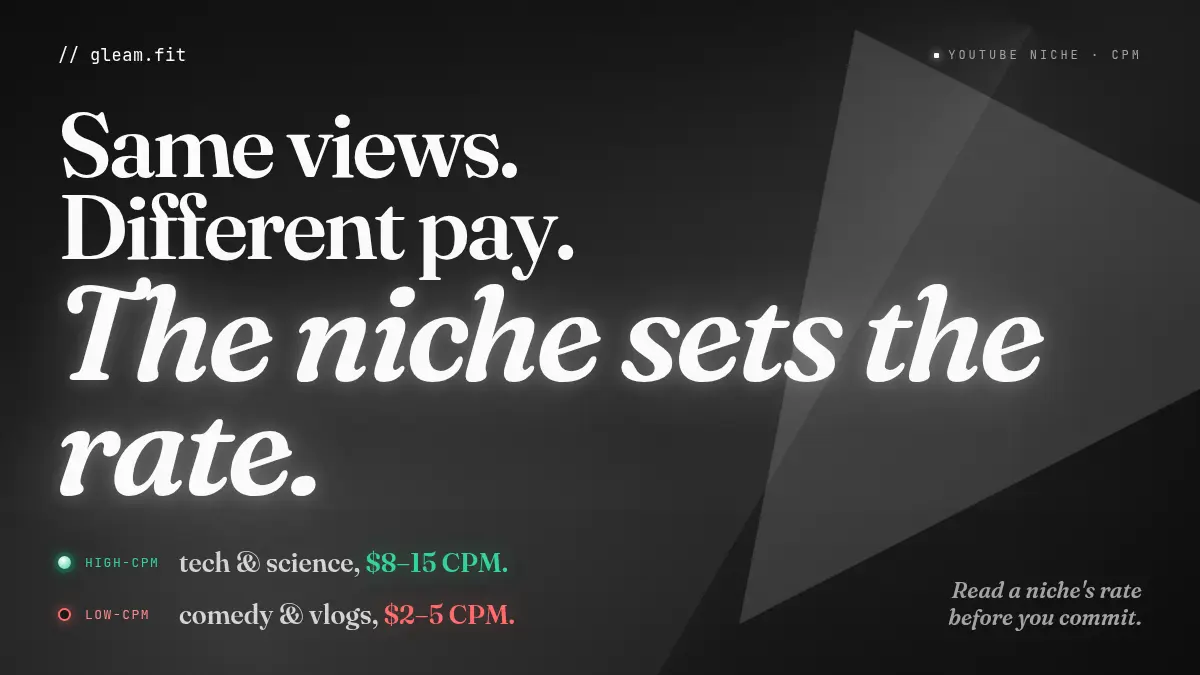
YouTube CPM by Niche: How to Read a Niche's Pay Ceiling Before You Commit
Two YouTube niches with the same views can earn very different money. A niche sets its CPM band the day you pick it — here's how to read that pay ceiling before you commit.
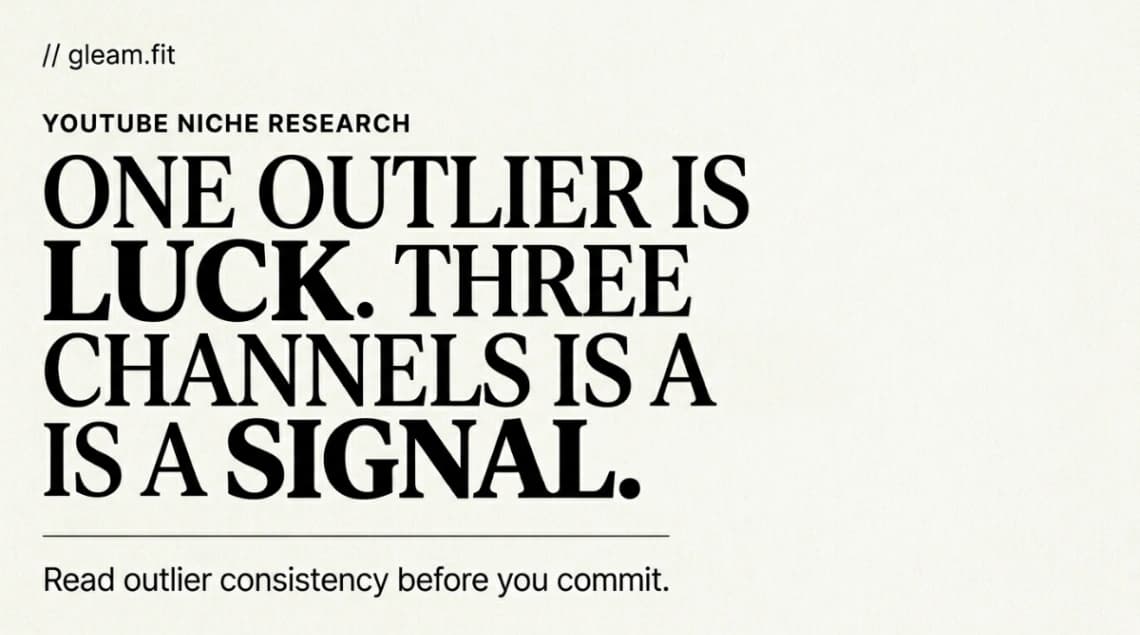
One Outlier Is Luck. Three Across Channels Is a Niche Signal
One viral outlier can be luck. When the same format outperforms across several channels in a niche, it signals demand you can read before you commit.
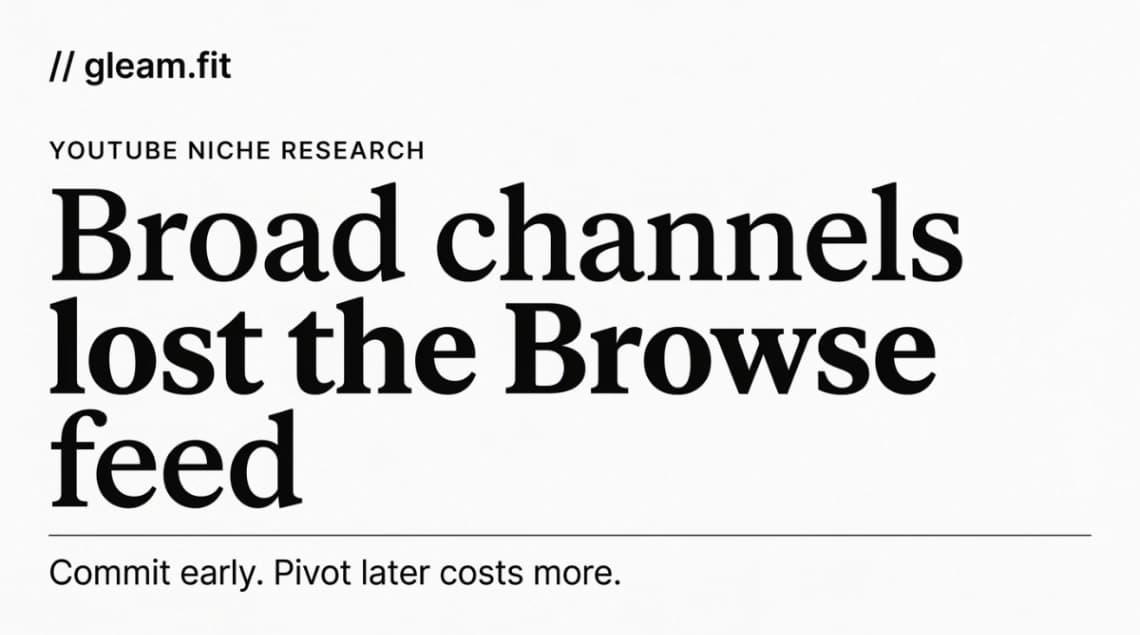
How YouTube's 2026 Browse Feed Rewards Niche Commitment
The 2026 micro-niche clustering claim traces to blogs citing each other. Here is what YouTube documents about niche commitment, and where it contradicts.